

e-Sens autonomous analyzer
The e-Sens Autonomous Water Analyzer:Systems Never Run Blind Between Visits
Between service visits, most treated systems go untested. The plant employee who used to run the tests was cut years ago, the log sheet by the tower is blank, and whatever drifts stays drifted until the next visit finds it. The e-Sens autonomous inline analyzer closes that gap. It runs the wet chemistry your technicians run on site, automatically, on schedule, and sends every result to the AquaCore Hub over the same cellular connection as your controllers.
See analyzer results live How it connects
National
AquaCore is the e-Sens distributor
Between visits
Runs on schedule
23
Parameters per sample
Definition
What is an autonomous water analyzer?
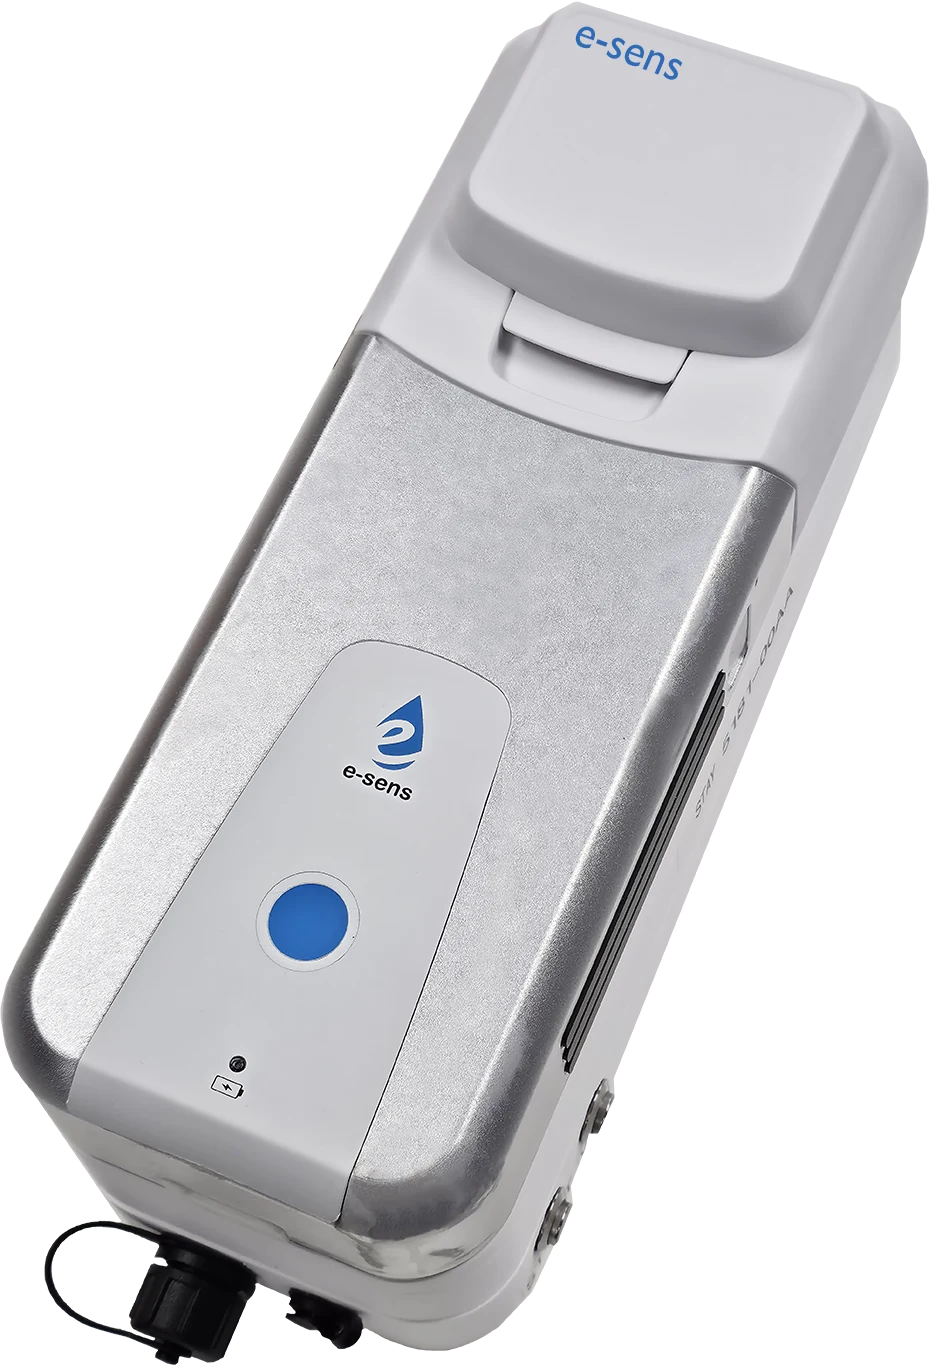
An autonomous water analyzer is an inline device that performs water chemistry tests automatically, without an operator. Instead of waiting for a technician’s visit or relying on plant staff to test and log readings, the analyzer samples the system on a set schedule, runs the analysis, and transmits results to a monitoring platform.
Full wet chemistry, run automatically, with nobody on site. It installs on a quick connect off the process line, so there is no dedicated sample panel and no re-pipe, and it sends every result over the same AquaCore cellular link as your controllers. No plant network, no IT ticket, no site survey.
Tests run on the schedule you set, and your rep can trigger one on demand from a phone without driving out. Results arrive as they are read, so a decision gets made the same day instead of at the next visit.
e-Sens is the US manufacturer and OEM of the analyzer. AquaCore is the national distributor, and integrates it with the panels, the cellular link, and the Hub so results land alongside your controller data instead of in a separate system.
Physical & general3 of 5
Hardness & calcium3
Alkalinity & carbon3 of 4
Scale & corrosion indices3
23 parameters per sample · twelve shown · nobody on siteNext sample 12:00
The 23-parameter cartridge
What does e-Sens actually measure?
One sample, 23 results, no operator. The full cartridge covers disinfection chemistry, hardness, alkalinity, and the scale and corrosion indices a cooling tower program is actually run on, so a rep sees the same numbers they would have carried back from a site visit. It runs EPA-approved analytical methods.
See the full parameter list23 parameters · ranges · accuracy
| Parameter | Units | Operating range | Accuracy (whichever is greater) | MDL |
|---|---|---|---|---|
| PHYSICAL & GENERAL | ||||
| °C | 2.0 – 45.0 °C | ±1 °C / ±1 °C | 2.0 °C | |
What this tells you Every other reading is temperature dependent. Conductivity, LSI and RSI are all corrected against it, so a bad temperature quietly corrupts the indices. On a tower loop a climbing sample temperature also flags falling heat rejection before anyone reads the approach. | ||||
| — | 5.00 – 11.00 | ±0.1 pH / ±0.1 pH | 5.00 – 11.00 | |
What this tells you The master variable. Corrosion inhibitors, biocides and every scale index assume a pH window, and outside it the chemistry you are paying for stops working. Drifting above roughly 8.8 heads toward calcium carbonate scale; below 7.0 heads toward mild steel corrosion. | ||||
| mV | −1000 – 2000 mV | ±10% / ±10% | ±10% | |
What this tells you The oxidising power actually present in the water, as opposed to the biocide you dosed. A residual that reads fine while ORP sits under target means halogen demand is winning: organic load, a fouled system, or a feed that is not reaching the water. | ||||
| µS/cm | 50 – 2500 µS/cm | ±10% / ±20 µS/cm | 50 µS/cm | |
What this tells you The proxy for dissolved solids and the basis for cycles of concentration. A step change is rarely chemistry. It is usually a bleed valve stuck open or shut, a change of makeup source, or a controller that has lost its probe. | ||||
| mg/L | 25 – 1250 mg/L | ±10% / ±10 mg/L | 25 mg/L | |
What this tells you Conductivity expressed as concentration, and what the scale and corrosion indices actually consume. Rising TDS at unchanged bleed means the system is over cycling and moving toward saturation. | ||||
| DISINFECTION | ||||
| mg/L Cl2 | 0.07 – 5.00 mg/L | ±10% / ±0.10 mg/L | 0.07 mg/L | |
What this tells you Disinfectant still available to kill. Read against the dose it separates a feed problem from a demand problem: a low residual with correct feed means something in the system is consuming it. | ||||
| mg/L Cl2 | 0.07 – 5.00 mg/L | ±10% / ±0.10 mg/L | 0.07 mg/L | |
What this tells you Combined chlorine, which persists further into a system than free chlorine does. Where the makeup is chloraminated this is the residual actually being carried, and the one worth trending. | ||||
| mg/L Cl2 | 0.07 – 5.00 mg/L | ±10% / ±0.10 mg/L | 0.07 mg/L | |
What this tells you Free plus combined. Its gap against free chlorine is the useful number, because it shows how much of the halogen has already reacted rather than how much was added. | ||||
| mg/L N-NH3 | 0.07 – 5.00 mg/L | ±10% / ±0.20 mg/L | 0.07 mg/L | |
What this tells you Feeds both chloramine formation and nitrifying bacteria. Present where nobody dosed it, it generally points at makeup contamination or process leakage into the loop. | ||||
| mg/L N-NH3 | 0.07 – 5.00 mg/L | ±10% / ±0.20 mg/L | 0.07 mg/L | |
What this tells you The unreacted portion. Excess free ammonia in a chloraminated system means the chlorine to ammonia ratio has slipped and nitrification risk is climbing. | ||||
| mg/L N-NH3 | 0.07 – 5.00 mg/L | ±10% / ±0.20 mg/L | 0.07 mg/L | |
What this tells you Free ammonia plus ammonium. This is the figure to trend while chasing a nitrification problem, because the split between the two moves with pH. | ||||
| — | 0.01 – 100.0 | ±10% / ±0.5 | n/a | |
What this tells you The control variable for chloramination. Off the target ratio you either break point out and lose the residual, or leave free ammonia behind to feed nitrifiers. | ||||
| mg/L N-NO3 | 0.07 – 10.0 mg/L | ±10% / ±0.20 mg/L | 0.07 mg/L | |
What this tells you Nitrite and nitrate accumulating is direct evidence that nitrifying bacteria are established and eating the residual. It turns a suspicion into a measurement. | ||||
| HARDNESS & CALCIUM | ||||
| mg/L CaCO3 | 5 – 1000 mg/L | ±10% / ±10 mg/L | 5 mg/L | |
What this tells you The primary scale former in cooling systems and a direct input to LSI. Calcium rising while conductivity holds steady means the makeup water changed, not the cycles. | ||||
| mg/L CaCO3 | 5 – 1000 mg/L | ±10% / ±10 mg/L | 5 mg/L | |
What this tells you Calcium plus magnesium. Read against calcium alone it tells you which salt is driving the scale risk, which decides whether an inhibitor change will help. | ||||
| mg/L Ca | 3 – 400 mg/L | ±10% / ±5 mg/L | 3 mg/L | |
What this tells you The fraction genuinely available to precipitate, rather than what is already complexed by the treatment. Closer to what the system will actually do than total hardness is. | ||||
| ALKALINITY & CARBON | ||||
| mg/L CO2 | 0.05 – 50 mg/L | ±10% / ±1 mg/L | 0.05 mg/L | |
What this tells you Drives pH down and carbonic acid corrosion in condensate and closed loops. High carbon dioxide alongside falling pH is the classic condensate return problem. | ||||
| mg/L CaCO3 | 10 – 325 mg/L | ±10% / ±10 mg/L | 10 mg/L | |
What this tells you The buffer. Low alkalinity means pH will swing on any acid or carbon dioxide upset. High alkalinity together with high calcium is scale waiting for a warm day. | ||||
| mg/L CaCO3 | 10 – 325 mg/L | ±10% / ±10 mg/L | 10 mg/L | |
What this tells you The dominant alkalinity species in most cooling water, and the one that converts to carbonate as pH climbs. Watching it separately shows the scale mechanism forming rather than just its result. | ||||
| mg/L CO2 | 1 – 200 mg/L | ±10% / ±1 mg/L | 1 mg/L | |
What this tells you Total carbonate carbon across every species. Because it does not shift with pH the way the individual species do, it is the honest measure of how much carbonate the water is carrying. | ||||
| SCALE & CORROSION INDICES | ||||
| — | −10 – 10.00 | 0.20 / n/a | n/a | |
What this tells you Calcium carbonate saturation. Positive and scale forms, negative and the water is aggressive to metal. Computed here from measured pH, calcium, alkalinity and temperature rather than from assumed values. | ||||
| — | 0 – 12.00 | 0.20 / n/a | n/a | |
What this tells you A second read on the same question with a different weighting. When LSI and RSI disagree the water is sitting near the boundary, which is exactly when a site is worth a visit. | ||||
| — | 7.00 – 15.00 | ±0.20 / n/a | 7.00 | |
What this tells you A corrosivity index used where cement lined pipe is in service. Below roughly 10 the water is actively aggressive to the lining, which is a slow and expensive failure. | ||||
All numerical values and percentages are subject to change. Source: e-Sens 23-parameter cartridge specification.
See the analyzer specificationspower · comms · enclosure · certifications
| Cartridge capacity | 100 samples per cartridge | Power | 110V AC, 50/60 Hz, 25 W typical |
|---|---|---|---|
| Communication | WiFi, Ethernet, Cellular | Enclosure | NEMA 4X |
| Mounting | Horizontal, quick-connect fitting, 3/8″ OD tubing | Certifications | CE, RoHS, FCC |
More from e-Sens
Not every test happens at the panel.
The inline analyzer is the part that fits an AquaCore program. e-Sens makes two other things a water treatment company can use on its own, and AquaCore can supply both.
Both are e-Sens products, sold and supported by e-Sens. Inside an AquaCore program the inline analyzer reports into the Hub instead, beside your controller data, so your team works one screen and your customer sees one brand.
Handheld
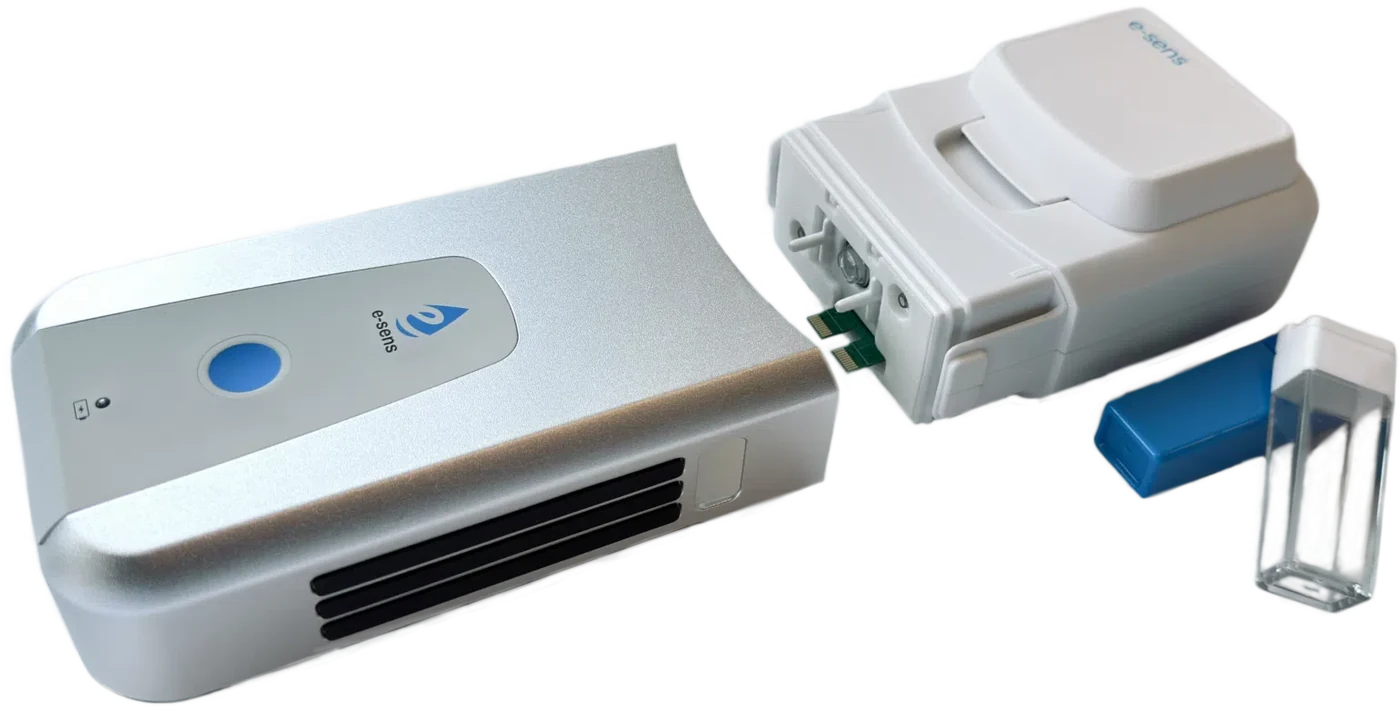
ROAM
A handheld tester for spot checks away from the panel. Drop in a cartridge, fill the cuvette, read the result on your phone. The same chemistry as the inline analyzer, carried in a truck.
Results go into the same app, so a spot check is logged the way a scheduled test is.
Field data collection
The e-Sens app
A free field collection app that replaces the paper log sheet. It records any test your team runs, e-Sens equipment or not, and e-Sens states it integrates with LIMS and SCADA systems through a web portal.
- No transcription step, so no transcription errors.
- User, GPS and timestamp on every entry: audit trail and chain of custody.
- Threshold breaches alert the moment a reading is entered.
- Route tracking, so a skipped test shows up instead of going unnoticed.
The exposure
What is the risk of untested weeks?
Every untested week is exposure. If the biocide feed drifts and residuals fall short, biological fouling starts long before anyone sees it. If conductivity control fails, scale forms on heat transfer surfaces. By the time the next service visit discovers the problem, the conversation has changed from program adjustment to system remediation, and sometimes to liability. Between-visit testing surfaces these problems in hours instead of weeks.
How treaters use it
How do water treatment companies use between-visit testing?
Risk avoidance
Catch drift the day it happens
Correct it remotely or with a targeted visit, instead of discovering it weeks later.
Assurance
Assurance customers can see
Every customer system is tested continuously, not just on visit day. It is a retention story and a renewal differentiator.
New service line
A billable recurring service
Offer between-visit testing as a billable service. Recurring revenue that requires no additional truck, route, or hire.
Who keeps it running
The Guardian Promise
You are selling assurance to your customer. Somebody has to assure the instrument.
Watched in real time
Faults caught before you hear about them
e-Sens monitors every deployed analyzer continuously and addresses problems before they reach your customer.
Daily calibration
It calibrates itself
A full calibration runs every day, automatically. No technician, no reagent trip, no calendar reminder.
No contract
No maintenance or service agreement
The device carries no maintenance contract and no service contract. Support is part of the promise, not a line item.
Frequently asked questions
Autonomous testing questions
What is autonomous water testing?
Autonomous water testing uses an inline analyzer to run water chemistry tests automatically, without a technician or plant operator present. The e-Sens analyzer samples the system on a schedule, performs the analysis, and sends results to the AquaCore Hub, so water treatment teams see chemistry data between service visits.
Why does testing between service visits matter?
Problems in treated water systems develop between visits: biocide feed drift, low residuals, scale-forming conditions. Without testing, those problems go undetected until the next visit, when correction is more expensive. Between-visit testing surfaces drift within hours so it can be corrected before it becomes damage.
Can water treatment companies bill for autonomous testing?
Yes. Many water treatment companies package between-visit testing and monitoring as a billable service for their customers. It adds recurring revenue without additional service routes or headcount, while giving customers documented assurance that their systems are continuously tested.
How do analyzer results reach the AquaCore Hub?
The e-Sens analyzer sends results over the same AquaCore cellular connection used by the control panels, with no plant network involvement. Results land in the AquaCore Hub alongside controller data, where they feed trends, alarms, and AI-generated virtual service reports.
Can a test be run remotely, without going to site?
Yes. Alongside the schedule you set, a rep can trigger a test on demand from a phone and see the result without leaving the office. That turns a drive across the state into a thirty-second check, and it means a suspect reading can be confirmed before anyone is dispatched.
Does the analyzer need ethernet or WiFi?
No. Ethernet and WiFi are supported where a customer prefers them, but cellular is the default precisely so deployment never depends on plant IT. Nothing touches the customer’s network, and there is no VPN request, no firewall rule, and no site survey.
How many analyzers does a site need?
One analyzer per cooling tower gives continuous coverage of that system. A single unit can also be relocated between systems where a site wants rotating coverage rather than permanent monitoring on every tower.
Does the analyzer need a maintenance contract?
No. There is no maintenance contract and no service contract on the device. It runs a full calibration daily on its own, and e-Sens monitors every deployed analyzer in real time under the Guardian Promise, addressing faults before they reach the customer.
See live data from systems running today.
We will walk you through fleet view, site analytics, analyzer results, and an AI virtual service report generated from real systems in service. Ask about charter dealer availability.