

The AquaCore Hub
Every Site, One Platform,Reports That Write Themselves
Data has no value until someone can act on it. The Hub reads everything your controllers and analyzers send, then writes the service report your rep would have written by hand. Your team reviews it, owns it, and delivers it under your brand.
Built by operators
Built by people who run treatment programs, not a software vendor.
Every screen in the Hub exists because a route needed it. It was designed inside a working treatment operation by the people writing the service reports, and it is running on live systems today. One login, every connected site, whatever the fleet is doing right now.
The white label
Your brand, front and center.
Your customers never see AquaCore. The panel on the wall carries your label, the platform carries your name, and the login your accounts sign in to is yours. We are the company behind it, and we stay behind it. Put your name in and see it.
YOUR COMPANY HUB
Welcome back.
Sign in to access your tools and customer data.
© 2026 Your Companyyourcompany.com
INDUSTRIAL WATER TREATMENT
Every system, one clean view.
Boilers, cooling towers, and closed loops, tracked in one place.
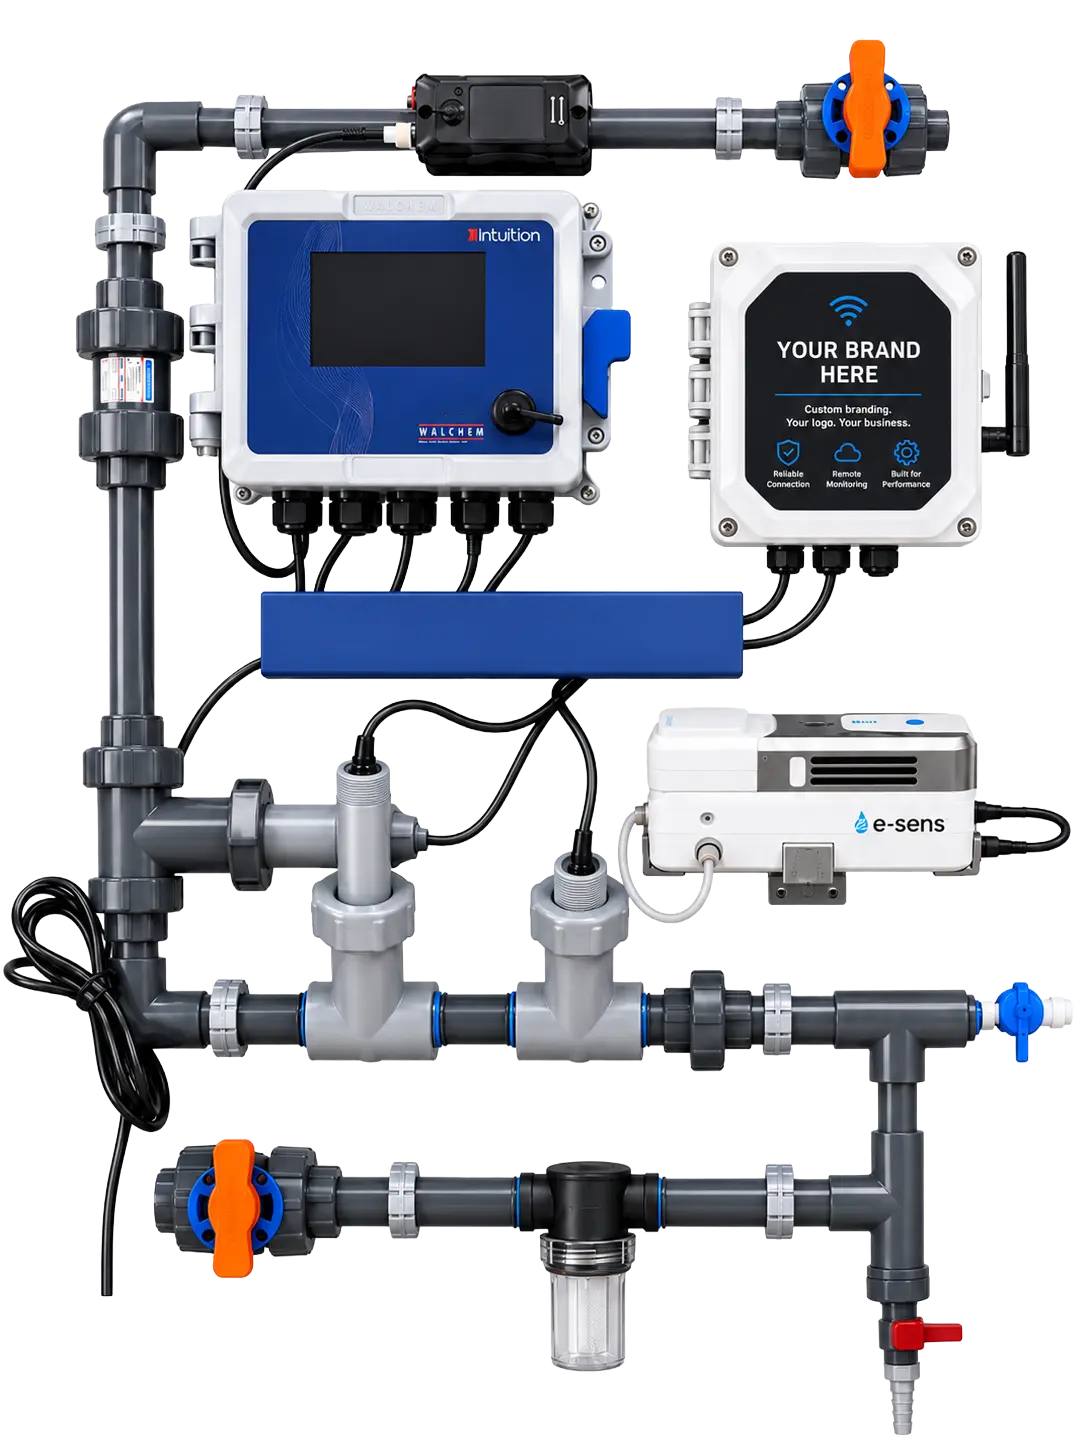
Panel labels, faceplates, platform name, logo and colours are configured before your first unit ships. Tell us what you want it called and we will show you a mock-up of your Hub before you commit to anything.
The analyst in the Hub
Ask the data a question, get an answer.
Point it at a device and it explains what is drifting and why, checks what is tripping across the fleet, and drafts the service report from the same data your rep would have read by hand.
- Generate a service report. Full analysis of the device on screen.
- Check active alarms. What is tripping across the fleet right now.
- Ask about a device. Find it by name or serial, or ask why it is behaving that way.

The differentiator
What is an AI virtual service report?
A virtual service report is a service report generated from live system data instead of a site visit. The AquaCore Hub’s AI analyzes controller readings, analyzer results, and trends, then drafts the report a technician would otherwise write by hand: system status, chemistry results, exceptions, and recommendations. Technicians review and approve before anything goes to a customer. The result is that every account gets documented attention between visits, and every visit starts with the homework already done.
TRENDS · EVERY SENSOR, EVERY INPUT
µS/cm · TWR CONDCONDUCTIVITY
°F · TEMPTEMPERATURE
gpm · PANEL FLOWFLOW
mV · TWR ORPORP
ppm · PTSAPTSA
gal · TWR MAKEUPFLOW
Virtual service report drafted, ready for rep review
VIEW →The service model
How does the Hub change the service model?
Service routes today are built on guesswork. Every account gets visited on the same cycle whether it needs it or not, and most of what a tech finds is that nothing changed.
With the Hub, routes follow the data. Accounts running clean get a virtual service report. Accounts drifting get the visit. Nothing goes unattended, and nothing gets a truck it did not need.
That is the whole commercial case. Windshield time turns into service time, coverage per rep goes up without another truck, and the customer sees more documented attention rather than less.
Frequently asked questions
Hub questions
What is the AquaCore Hub?
The AquaCore Hub is a cloud platform for water treatment companies that collects data from cooling tower controllers and autonomous water analyzers. It provides fleet status across all connected sites, site-level user permissions, analytics on every sensor and control output, scheduled reporting, and AI-generated virtual service reports.
Do AI reports replace service visits?
No. Virtual service reports document system performance between visits and help teams decide where visits are needed most. On-site service, chemistry handling, and the customer relationship remain the water treatment company’s work. The AI drafts the paperwork and flags the priorities.
Who can see the data in the AquaCore Hub?
Access is permission-based at the site level. A water treatment company controls which employees see which accounts and which of its customers see their own sites. Data ownership and export rights belong to the water treatment company.
See live data from systems running today.
We will walk you through fleet view, site analytics, analyzer results, and an AI virtual service report generated from real systems in service. Ask about charter dealer availability, or book a meeting slot at the AWT Annual Convention.